SESAR 3 JU exploratory research, 2023–2026

Synthetic data for AI in air traffic management

SynthAIr developed and evaluated generative models that reproduce the statistical and operational properties of real flight data, so AI can be trained and tested when real data is scarce, sensitive or rare.

  • Completed February 2026
  • TRL 1
  • Grant agreement 101114847

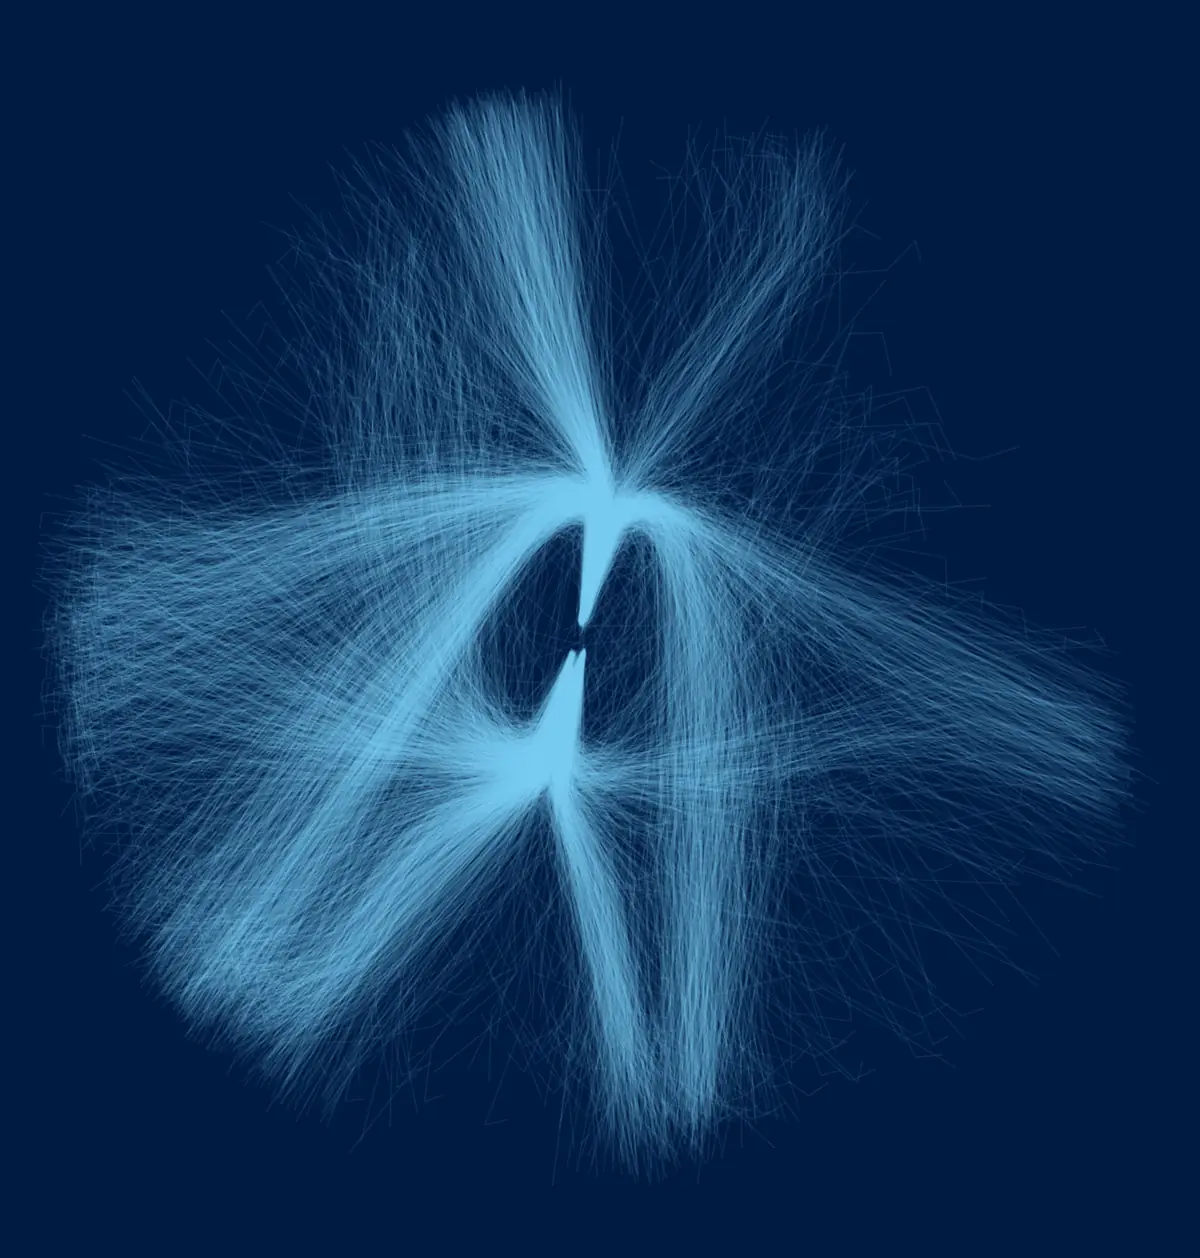
Pictured: each line is a synthetic landing at Oslo Gardermoen (SESAR Innovation Days 2024 poster).

Thousands of fine synthetic landing trajectories converging on an airport from all directions

The results in 30 seconds

Synthetic flights. Real results.

Can’t access or share the data?

95–97%

of real-data performance kept by turnaround and delay forecasts trained only on synthetic flights.

Compared with training on real data (full bar)

  • Turnaround97%
  • Departure delay96%
  • Arrival delay95%

A share of what real data achieves, not accuracy: even real data only reaches R² ≤ 0.44 here. This generator also has the smallest privacy margin of the four.

1.7 million European flights
CEAS Aeronautical Journal, 2026

Events too rare to learn from?

>6×

higher PR-AUC for predicting flight diversions after adding 1,000 synthetic ones. Only about 1 flight in 480 diverts.

PR-AUC, higher is better

  • Real data only0.066
  • Real + synthetic0.44

Best of three tuned generators (0.28 to 0.44), on one month of New York flights.

127 diversions among about 61,000 flights
Aerospace Science and Technology, 2026

New airport, little local data?

5%

of Dublin’s data, fewer than 1,000 landings, brought a model pretrained on Zürich close to one built from all of it.

Share of Dublin’s training data

  • 5%: close to the baseline
  • 20%: level with it

One airport pair and a diffusion model. Rarer west-facing approaches stay underrepresented.

Zürich to Dublin
SESAR Innovation Days 2025

All three were measured against real flight data. This is early-stage research at TRL 1, not an operational system. The project met all 17 validation criteria; the seven on operational impact are qualitative and preliminary (D5.2).

See the evidence

The challenge

AI in air traffic management is short of data

Machine learning needs large, shareable and varied datasets. Operational aviation data is often none of these. SynthAIr explored whether generated data can fill the gap, and measured where it can and cannot.

  • Data scarcityComprehensive operational datasets are hard to obtain.
  • Privacy and commercial sensitivityFlight and passenger records often cannot be shared freely.
  • Rare eventsDiversions and extreme delays are too infrequent to learn from directly.
  • GeneralisationModels trained at one airport do not transfer easily to another.
  1. Real data

    European flight records from OAG, U.S. on-time data from BTS, ADS-B trajectories from OpenSky, and the EUROCONTROL R&D Archive.

  2. Generative models

    Ten models for tabular records and trajectories, from statistical copulas to transformers and diffusion.

  3. Evaluation

    Fidelity, diversity, privacy and flyability, plus utility: train on synthetic data, test on real data.

  4. Use

    Six ATM use cases, and general-purpose embeddings for analytics and transfer between airports.

See the data

Real and synthetic, side by side

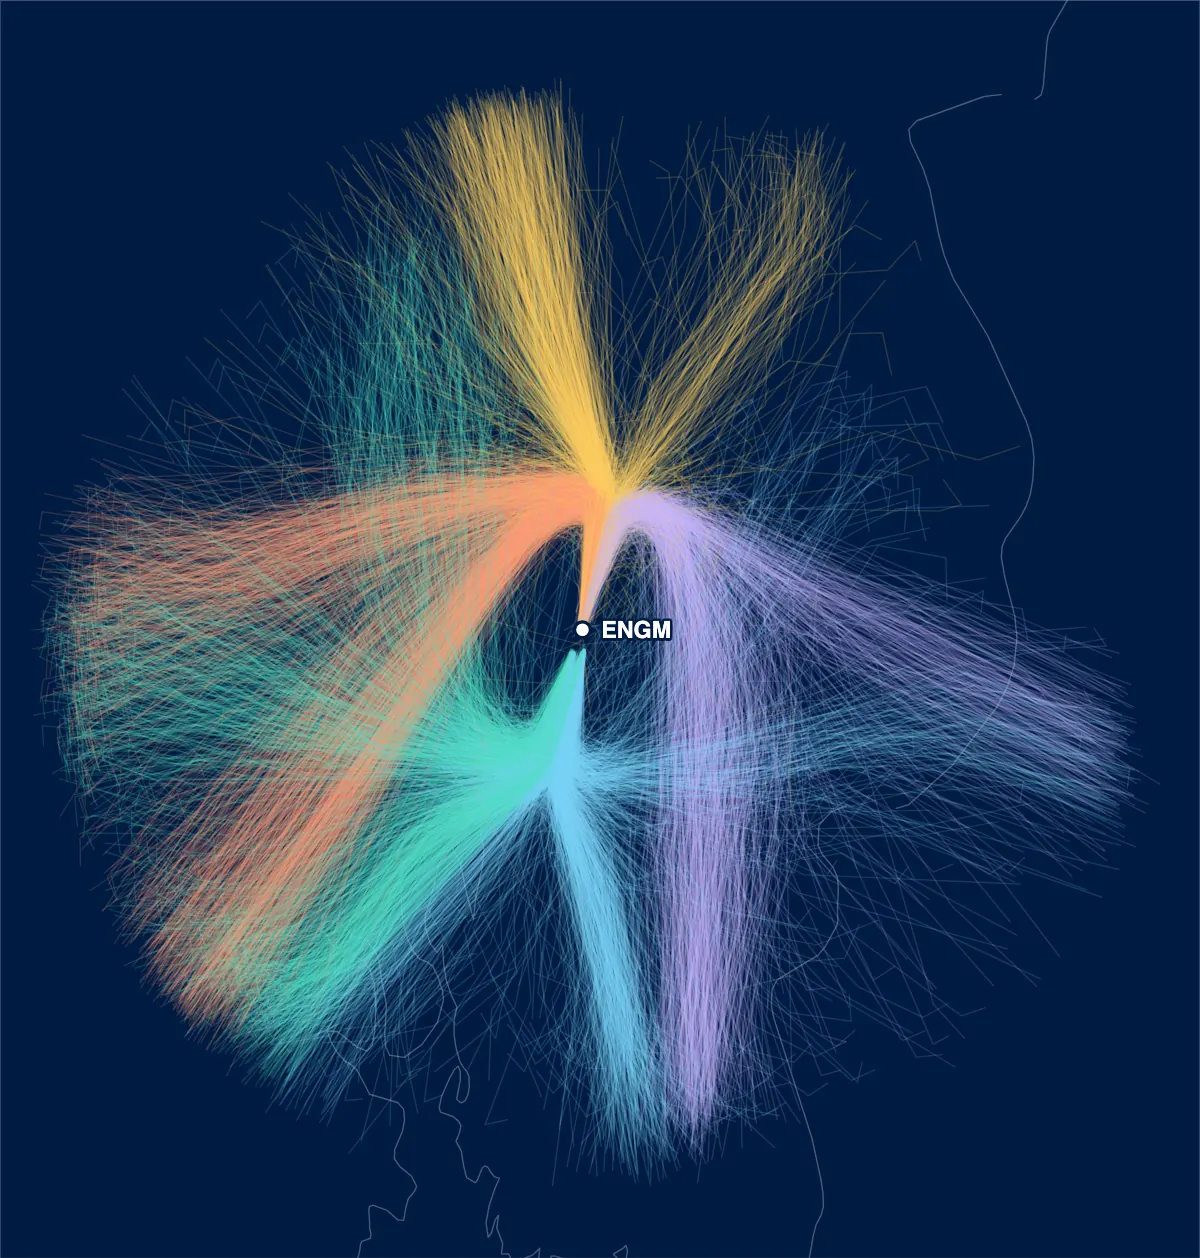
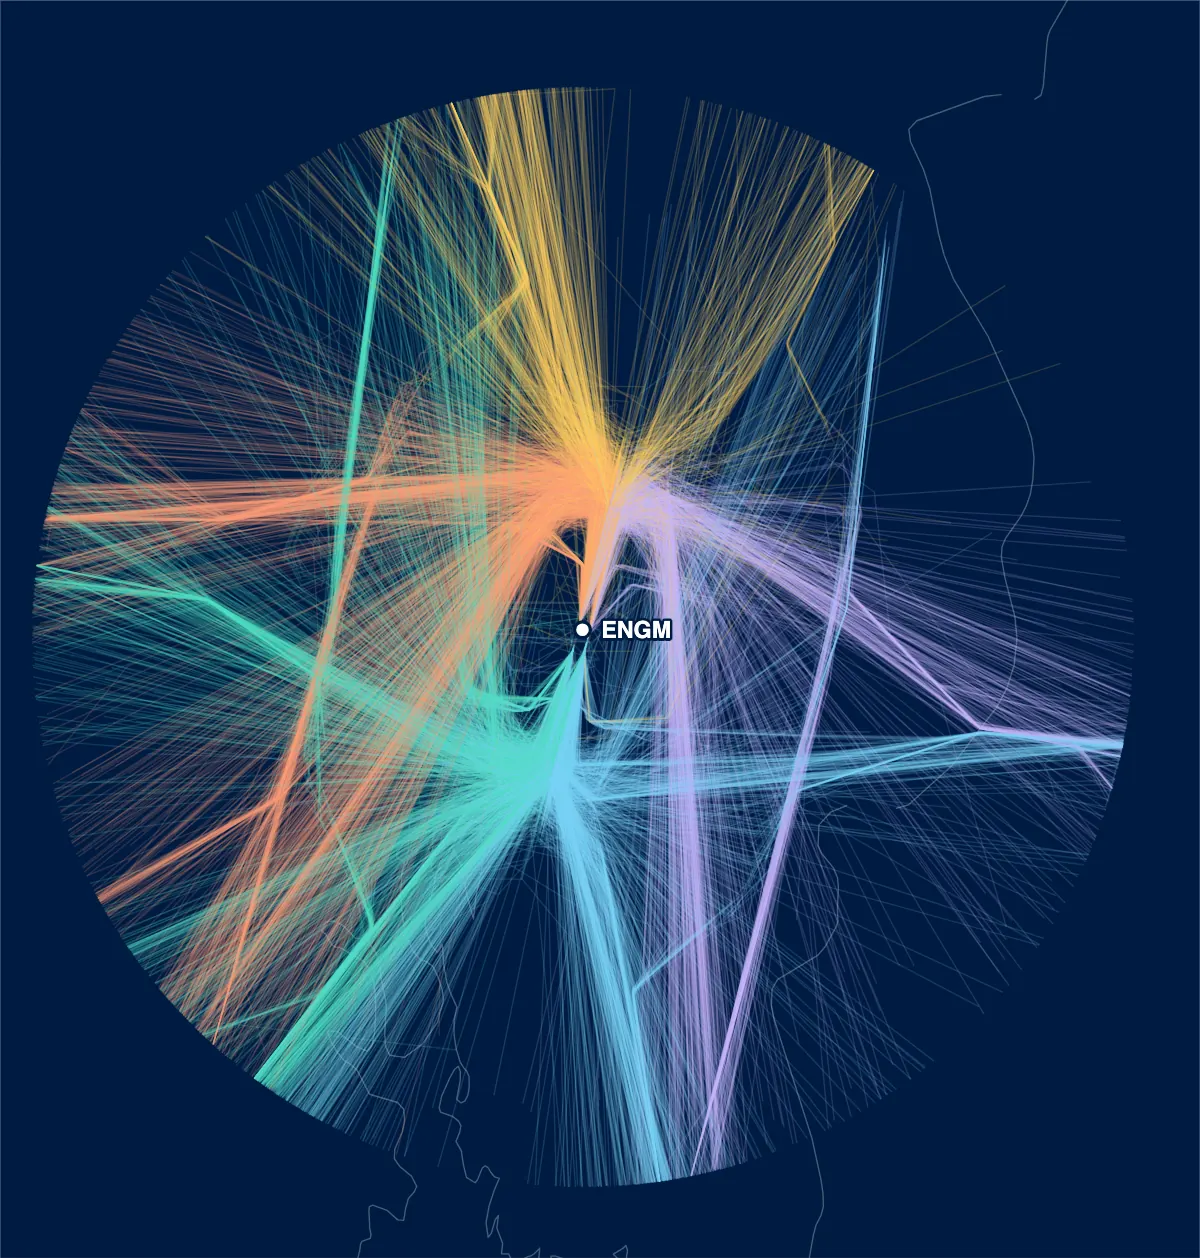
Landing trajectories around Oslo Gardermoen. Drag the divider to compare the real training data with what a SynthAIr model generated from it.

  • What the model captures: the main approach corridors and their clusters, in the right places.
  • What it smooths: the sharply defined straight routes and the hard edge of the real data, which blur in the synthetic set.

Colours mark the five trajectory clusters. A visual match is only a first check: see the full evaluation in UC4. Synthetic Oslo landing trajectories are available as an open dataset on Zenodo.

Synthetic landing trajectories around Oslo Gardermoen, grouped in five smooth clusters Real training trajectories around Oslo Gardermoen, showing the same clusters with sharper straight routes Real Synthetic

Use cases

Six use cases across the flight timeline

From waiting at airport security to the next departure: what was tested in each use case, and what came out of it.

UC1

Turnaround Time Prediction

How long will an aircraft stay on the ground between flights?

Read the use case
0.97 Average utility score with REaLTabFormer, where 1.0 equals training on real data
Data
About 1.7 million European flight records (OAG) and U.S. BTS records
Models
REaLTabFormer, TabSyn, CTGAN, Gaussian Copula, TVAE
UC2

Flight Delay Prediction

How late will a flight depart and arrive?

Read the use case
0.95–0.96 Pre-tactical utility score with REaLTabFormer across arrival and departure delays
Data
About 1.7 million European flight records (OAG) and U.S. BTS records
Models
REaLTabFormer, TabSyn, CTGAN, Gaussian Copula, TVAE
UC3

Passenger Flow Prediction

How long do passengers wait at airport security?

Read the use case
0.138 R² with 100× synthetic data, against −0.168 with real data only
Data
2,277 passengers at Rotterdam The Hague Airport
Models
TVAE
UC4

Synthetic Traffic Generator

Can generated trajectories stand in for real ones in ATM studies?

Read the use case
0.0029 FID for TimeVQVAE on Amsterdam–Milan, against 0.7944 for TCVAE (lower is better)
Data
OpenSky ADS-B and the EUROCONTROL R&D Archive
Models
TimeVQVAE, TCVAE, TimeGAN, flow matching, diffusion
UC5

Flight Diversion Prediction

Which flights will divert to another airport?

Read the use case
0.44 PR-AUC with the best optimised generator (TVAE), against 0.066 on real data alone
Data
U.S. BTS records, with 127 diversions among about 61,000 flights
Models
TVAE, CTGAN, CopulaGAN, Gaussian Copula
UC6

Schedule Prediction

Can missing flight schedule information be recovered?

Read the use case
18.31 min Arrival delay MAE when training on TVAE synthetic data, against 27.22 min on real data
Data
U.S. BTS records
Models
TVAE, Gaussian Copula

Results

What the evaluation shows

Three findings from the final deliverables and papers, with their limits. All results are exploratory, at Technology Readiness Level 1.

No generator wins on every dimension

REaLTabFormer kept the most predictive value on all three tasks, but offered the smallest privacy margin. Gaussian Copula did the reverse. The right choice depends on how sensitive the data is.

Distance to closest record is a useful early indication of privacy, not a formal guarantee.

Compare the models
Utility and privacy scores per generator, on the European OAG data
UtilityPrivacy
TurnaroundDeparture delayArrival delayBaseline protection
REaLTabFormer0.970.960.950.23
TabSyn0.930.760.640.30
CTGAN0.740.680.570.34
Gaussian Copula0.420.560.530.54
0.21.0Higher is better
Utility is the average score across prediction models, where 1.0 equals training on real data. Baseline protection compares distance to real records with a random baseline. Source: D3.3 v2: utility from Figures 5, 37 and 43, baseline protection from Figure 23.

Synthetic data helps with rare events, when the generator is tuned

Only 127 of about 61,000 flights in the dataset were diverted. In the journal study, adding synthetic diversions from optimised generators lifted PR-AUC from 0.066 on real data alone to between 0.28 and 0.44.

Gaussian Copula consistently underperformed on utility in that study, and the data lacks weather and traffic features that are likely to drive diversions.

Read UC5
0.00.10.20.30.40.5Real data only0.066CTGAN0.28CopulaGAN0.34TVAE0.44
PR-AUC for flight diversion prediction when real training data is augmented with records from optimised generators; higher is better. Source: Aly, Sharpanskykh and Hoekstra, Aerospace Science and Technology, 2026.

A little local data goes a long way

A diffusion model pretrained on Zürich and fine-tuned on Dublin got close to a Dublin baseline with 5% of the local data, and reached baseline-level performance at around 20%.

Rarer approaches, such as west-facing arrivals, remain underrepresented after transfer.

See transfer learning
Fine-tuned from Zürich± 1 standard deviationBaseline: trained from scratch on 100% of Dublin
Energy distance0.00.61.21.81.2280%0.6935%20%50%0.668100%Dynamic time warping04080120118.20%23.25%20%50%15.9100%
Data table
Dublin datae-distanceDTW
Baseline0.662 ± 0.17029.099 ± 0.106
0%1.228 ± 0.445118.222 ± 0.352
5%0.693 ± 0.18323.211 ± 0.084
20%0.681 ± 0.17822.941 ± 0.081
50%0.679 ± 0.17518.428 ± 0.067
100%0.668 ± 0.17115.876 ± 0.060
Diffusion model, Dublin landing trajectories. Lower is better. Source: Learning to Land Anywhere, SESAR Innovation Days 2025, Table II.

Models

Ten generative models, two data types

The latent representations these models learn also work as general-purpose embeddings for clustering, anomaly detection and core-set extraction.

Tabular flight records Details

  • REaLTabFormerTransformer

    Autoregressive generation that treats each flight record as a sequence of tokens

  • TabSynDiffusion

    Diffusion in a VAE latent space for efficient mixed-type synthesis

  • CTGANAdversarial

    Conditional training aimed at rare categories and imbalanced data

  • TVAEVariational

    Stable to train, with a light compute footprint

  • Gaussian CopulaStatistical

    Models dependencies separately from marginals; the strongest privacy margin of the four generators compared on European data

Aircraft trajectories Details

  • TimeVQVAEVector-quantised

    Time-frequency processing with transformer priors for global coherence

  • TCVAE with VampPriorVariational

    Temporal convolutions with a flexible mixture prior

  • TimeGANAdversarial

    Adversarial training that preserves temporal relationships

  • Flow matchingContinuous flows

    Continuous normalizing flows with deterministic, efficient sampling

  • Diffusion modelsDiffusion

    Denoising diffusion adapted to flight data; the strongest transfer between airports

The project

Four partners, thirty months

SynthAIr ran from 1 September 2023 to 28 February 2026 as a SESAR 3 Joint Undertaking exploratory research project. An external advisory board of airlines, air navigation service providers, airports and researchers shaped its technical direction through three workshops.

Meet the team   Events and videos

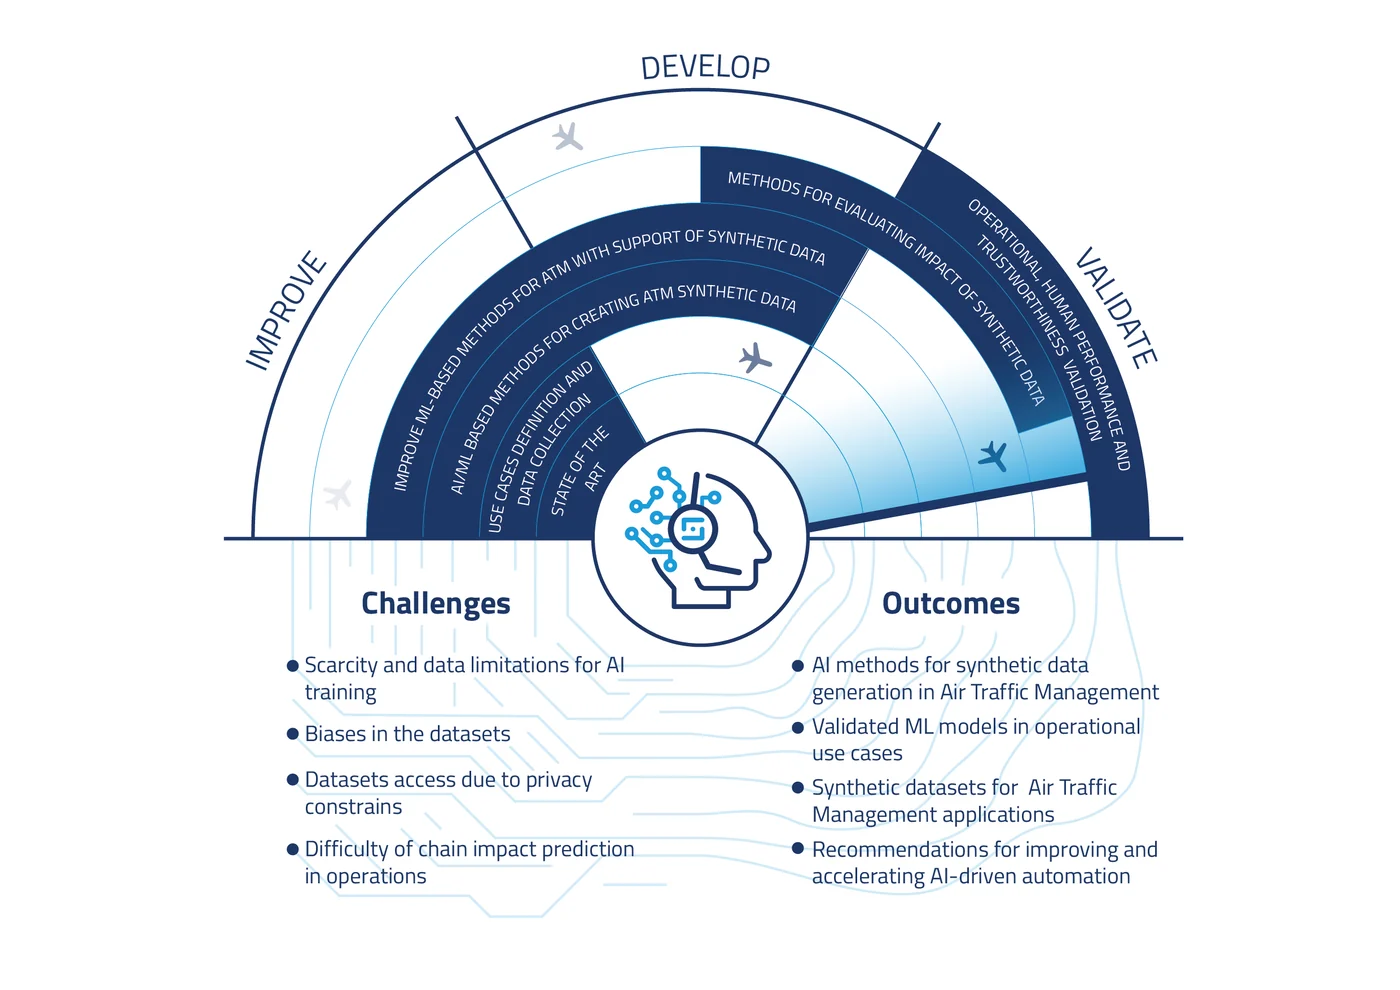
SynthAIr concept image. Three arcs labelled improve, develop and validate surround a head wearing a headset with circuit lines. Challenges: scarcity and data limitations for AI training, biases in the datasets, datasets access due to privacy constraints, difficulty of chain impact prediction in operations. Outcomes: AI methods for synthetic data generation in ATM, validated ML models in operational use cases, synthetic datasets for ATM applications, recommendations for improving and accelerating AI-driven automation.
SINTEFAI and machine learning; project coordinator
TU DelftAviation engineering
EUROCONTROLOperational air traffic management
Deep BlueValidation and dissemination
Co-funded by the European Union SESAR Joint Undertaking

This project has received funding from the SESAR 3 Joint Undertaking under grant agreement No 101114847 under European Union’s Horizon Europe research and innovation programme. Contact: Massimiliano Ruocco (SINTEF), massimiliano.ruocco@sintef.no .